Review


piggybac vector ppbcag ntom20 moxbfp gs lov2 ires puro  (Addgene inc)


Bioz Verified Symbol Addgene inc is a verified supplier  
  • Logo
  • About
  • News
  • Press Release
  • Team
  • Advisors
  • Partners
  • Contact
  • Bioz Stars
  • Bioz vStars
  • 93

    Structured Review

    Addgene inc piggybac vector ppbcag ntom20 moxbfp gs lov2 ires puro
    (A-D) Increased expression of a constitutively active GEF-H1 mutant in B16F1 mouse melanoma cells leads to enhanced cell contraction dynamics. (A) Representative TIRF images of cells transiently expressing myosin IIa (pCMV-mCherry-MHC IIA) together with the constitutively active GEF-H1 C53R mutant (pCMV5-EGFP-GEF-HI C53R) or a control vector (pEGFP-N1), respectively. Scale bar = 20 μm. (B) Corresponding kymograph analysis along the arrows in A. (C) Myosin IIa signal intensity plots corresponding to the orange box in A. (D) Quantification of average contraction pulse frequency, amplitude and width. N=41 GEF-H1 C53R cells and N=24 control cells from 3 independent experiments, Error bars represent S.E.M., Unpaired t-test. (E) Schematic representation of optogenetic GEF-H1 release from the mitochondria into the cytosol and subsequent stimulation of cell contraction dynamics by myosin IIa. (F) Schematic representation of stepwise strategy to generate stable B16F1 cell lines expressing a GEF-H1-coupled optogenetic tool, the corresponding control and fluorescently tagged read-out proteins. (G) Left: Representative epifluorescence images showing the mitochondrial anchored photo-sensitive <t>LOV2</t> domain <t>(NTOM20-moxBFP-LOV2)</t> and opto-control (mCitrine-Zdk1), or opto-GEF-H1 (mCitrine-Zdk1-GEF-H1 C53R) before, during and after optogenetic stimulation at 445-488 nm. Scale bar = 10 μm. Right: Intensity plots of opto-control and opto-GEF-H1 signal corresponding to the orange boxes in left panels.
    Piggybac Vector Ppbcag Ntom20 Moxbfp Gs Lov2 Ires Puro, supplied by Addgene inc, used in various techniques. Bioz Stars score: 93/100, based on 4 PubMed citations. ZERO BIAS - scores, article reviews, protocol conditions and more
    https://www.bioz.com/result/piggybac vector ppbcag ntom20 moxbfp gs lov2 ires puro/product/Addgene inc
    Average 93 stars, based on 4 article reviews
    piggybac vector ppbcag ntom20 moxbfp gs lov2 ires puro - by Bioz Stars, 2026-02
    93/100 stars

    Images

    1) Product Images from "Optogenetic stimulation of Lbc GEF-mediated Rho activity dynamics promotes cell invasion"

    Article Title: Optogenetic stimulation of Lbc GEF-mediated Rho activity dynamics promotes cell invasion

    Journal: bioRxiv

    doi: 10.1101/2025.03.28.646036

    (A-D) Increased expression of a constitutively active GEF-H1 mutant in B16F1 mouse melanoma cells leads to enhanced cell contraction dynamics. (A) Representative TIRF images of cells transiently expressing myosin IIa (pCMV-mCherry-MHC IIA) together with the constitutively active GEF-H1 C53R mutant (pCMV5-EGFP-GEF-HI C53R) or a control vector (pEGFP-N1), respectively. Scale bar = 20 μm. (B) Corresponding kymograph analysis along the arrows in A. (C) Myosin IIa signal intensity plots corresponding to the orange box in A. (D) Quantification of average contraction pulse frequency, amplitude and width. N=41 GEF-H1 C53R cells and N=24 control cells from 3 independent experiments, Error bars represent S.E.M., Unpaired t-test. (E) Schematic representation of optogenetic GEF-H1 release from the mitochondria into the cytosol and subsequent stimulation of cell contraction dynamics by myosin IIa. (F) Schematic representation of stepwise strategy to generate stable B16F1 cell lines expressing a GEF-H1-coupled optogenetic tool, the corresponding control and fluorescently tagged read-out proteins. (G) Left: Representative epifluorescence images showing the mitochondrial anchored photo-sensitive LOV2 domain (NTOM20-moxBFP-LOV2) and opto-control (mCitrine-Zdk1), or opto-GEF-H1 (mCitrine-Zdk1-GEF-H1 C53R) before, during and after optogenetic stimulation at 445-488 nm. Scale bar = 10 μm. Right: Intensity plots of opto-control and opto-GEF-H1 signal corresponding to the orange boxes in left panels.
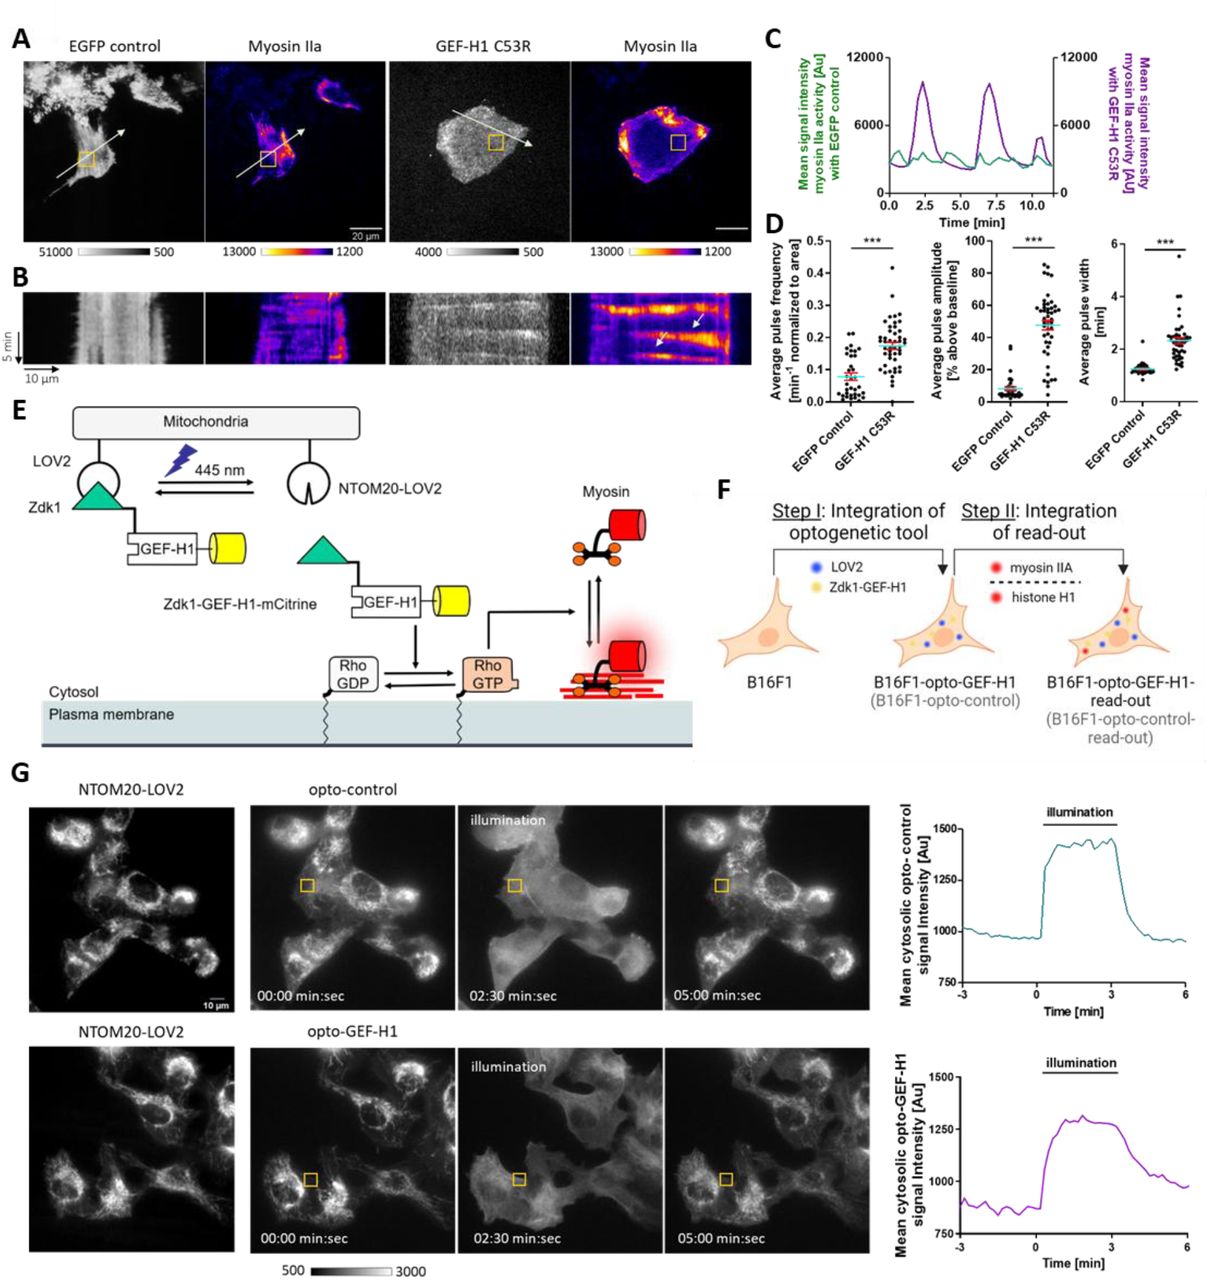
    Figure Legend Snippet: (A-D) Increased expression of a constitutively active GEF-H1 mutant in B16F1 mouse melanoma cells leads to enhanced cell contraction dynamics. (A) Representative TIRF images of cells transiently expressing myosin IIa (pCMV-mCherry-MHC IIA) together with the constitutively active GEF-H1 C53R mutant (pCMV5-EGFP-GEF-HI C53R) or a control vector (pEGFP-N1), respectively. Scale bar = 20 μm. (B) Corresponding kymograph analysis along the arrows in A. (C) Myosin IIa signal intensity plots corresponding to the orange box in A. (D) Quantification of average contraction pulse frequency, amplitude and width. N=41 GEF-H1 C53R cells and N=24 control cells from 3 independent experiments, Error bars represent S.E.M., Unpaired t-test. (E) Schematic representation of optogenetic GEF-H1 release from the mitochondria into the cytosol and subsequent stimulation of cell contraction dynamics by myosin IIa. (F) Schematic representation of stepwise strategy to generate stable B16F1 cell lines expressing a GEF-H1-coupled optogenetic tool, the corresponding control and fluorescently tagged read-out proteins. (G) Left: Representative epifluorescence images showing the mitochondrial anchored photo-sensitive LOV2 domain (NTOM20-moxBFP-LOV2) and opto-control (mCitrine-Zdk1), or opto-GEF-H1 (mCitrine-Zdk1-GEF-H1 C53R) before, during and after optogenetic stimulation at 445-488 nm. Scale bar = 10 μm. Right: Intensity plots of opto-control and opto-GEF-H1 signal corresponding to the orange boxes in left panels.

    Techniques Used: Expressing, Mutagenesis, Control, Plasmid Preparation


    Similar Products

    90
    Photoswitch Biosciences lov2- jα photoswitch
    Lov2 Jα Photoswitch, supplied by Photoswitch Biosciences, used in various techniques. Bioz Stars score: 90/100, based on 1 PubMed citations. ZERO BIAS - scores, article reviews, protocol conditions and more
    https://www.bioz.com/result/lov2- jα photoswitch/product/Photoswitch Biosciences
    Average 90 stars, based on 1 article reviews
    lov2- jα photoswitch - by Bioz Stars, 2026-02
    90/100 stars
      Buy from Supplier

    93
    Addgene inc piggybac vector ppbcag ntom20 moxbfp gs lov2 ires puro
    (A-D) Increased expression of a constitutively active GEF-H1 mutant in B16F1 mouse melanoma cells leads to enhanced cell contraction dynamics. (A) Representative TIRF images of cells transiently expressing myosin IIa (pCMV-mCherry-MHC IIA) together with the constitutively active GEF-H1 C53R mutant (pCMV5-EGFP-GEF-HI C53R) or a control vector (pEGFP-N1), respectively. Scale bar = 20 μm. (B) Corresponding kymograph analysis along the arrows in A. (C) Myosin IIa signal intensity plots corresponding to the orange box in A. (D) Quantification of average contraction pulse frequency, amplitude and width. N=41 GEF-H1 C53R cells and N=24 control cells from 3 independent experiments, Error bars represent S.E.M., Unpaired t-test. (E) Schematic representation of optogenetic GEF-H1 release from the mitochondria into the cytosol and subsequent stimulation of cell contraction dynamics by myosin IIa. (F) Schematic representation of stepwise strategy to generate stable B16F1 cell lines expressing a GEF-H1-coupled optogenetic tool, the corresponding control and fluorescently tagged read-out proteins. (G) Left: Representative epifluorescence images showing the mitochondrial anchored photo-sensitive <t>LOV2</t> domain <t>(NTOM20-moxBFP-LOV2)</t> and opto-control (mCitrine-Zdk1), or opto-GEF-H1 (mCitrine-Zdk1-GEF-H1 C53R) before, during and after optogenetic stimulation at 445-488 nm. Scale bar = 10 μm. Right: Intensity plots of opto-control and opto-GEF-H1 signal corresponding to the orange boxes in left panels.
    Piggybac Vector Ppbcag Ntom20 Moxbfp Gs Lov2 Ires Puro, supplied by Addgene inc, used in various techniques. Bioz Stars score: 93/100, based on 1 PubMed citations. ZERO BIAS - scores, article reviews, protocol conditions and more
    https://www.bioz.com/result/piggybac vector ppbcag ntom20 moxbfp gs lov2 ires puro/product/Addgene inc
    Average 93 stars, based on 1 article reviews
    piggybac vector ppbcag ntom20 moxbfp gs lov2 ires puro - by Bioz Stars, 2026-02
    93/100 stars
      Buy from Supplier

    93
    Addgene inc lov2 domain
    (A-D) Increased expression of a constitutively active GEF-H1 mutant in B16F1 mouse melanoma cells leads to enhanced cell contraction dynamics. (A) Representative TIRF images of cells transiently expressing myosin IIa (pCMV-mCherry-MHC IIA) together with the constitutively active GEF-H1 C53R mutant (pCMV5-EGFP-GEF-HI C53R) or a control vector (pEGFP-N1), respectively. Scale bar = 20 μm. (B) Corresponding kymograph analysis along the arrows in A. (C) Myosin IIa signal intensity plots corresponding to the orange box in A. (D) Quantification of average contraction pulse frequency, amplitude and width. N=41 GEF-H1 C53R cells and N=24 control cells from 3 independent experiments, Error bars represent S.E.M., Unpaired t-test. (E) Schematic representation of optogenetic GEF-H1 release from the mitochondria into the cytosol and subsequent stimulation of cell contraction dynamics by myosin IIa. (F) Schematic representation of stepwise strategy to generate stable B16F1 cell lines expressing a GEF-H1-coupled optogenetic tool, the corresponding control and fluorescently tagged read-out proteins. (G) Left: Representative epifluorescence images showing the mitochondrial anchored photo-sensitive <t>LOV2</t> domain (NTOM20-moxBFP-LOV2) and opto-control (mCitrine-Zdk1), or opto-GEF-H1 (mCitrine-Zdk1-GEF-H1 C53R) before, during and after optogenetic stimulation at 445-488 nm. Scale bar = 10 μm. Right: Intensity plots of opto-control and opto-GEF-H1 signal corresponding to the orange boxes in left panels.
    Lov2 Domain, supplied by Addgene inc, used in various techniques. Bioz Stars score: 93/100, based on 1 PubMed citations. ZERO BIAS - scores, article reviews, protocol conditions and more
    https://www.bioz.com/result/lov2 domain/product/Addgene inc
    Average 93 stars, based on 1 article reviews
    lov2 domain - by Bioz Stars, 2026-02
    93/100 stars
      Buy from Supplier

    90
    Addgene inc e. coli dhfr lov2 fusion with n-terminal 8x his-tag in phis8-3
    (A-D) Increased expression of a constitutively active GEF-H1 mutant in B16F1 mouse melanoma cells leads to enhanced cell contraction dynamics. (A) Representative TIRF images of cells transiently expressing myosin IIa (pCMV-mCherry-MHC IIA) together with the constitutively active GEF-H1 C53R mutant (pCMV5-EGFP-GEF-HI C53R) or a control vector (pEGFP-N1), respectively. Scale bar = 20 μm. (B) Corresponding kymograph analysis along the arrows in A. (C) Myosin IIa signal intensity plots corresponding to the orange box in A. (D) Quantification of average contraction pulse frequency, amplitude and width. N=41 GEF-H1 C53R cells and N=24 control cells from 3 independent experiments, Error bars represent S.E.M., Unpaired t-test. (E) Schematic representation of optogenetic GEF-H1 release from the mitochondria into the cytosol and subsequent stimulation of cell contraction dynamics by myosin IIa. (F) Schematic representation of stepwise strategy to generate stable B16F1 cell lines expressing a GEF-H1-coupled optogenetic tool, the corresponding control and fluorescently tagged read-out proteins. (G) Left: Representative epifluorescence images showing the mitochondrial anchored photo-sensitive <t>LOV2</t> domain (NTOM20-moxBFP-LOV2) and opto-control (mCitrine-Zdk1), or opto-GEF-H1 (mCitrine-Zdk1-GEF-H1 C53R) before, during and after optogenetic stimulation at 445-488 nm. Scale bar = 10 μm. Right: Intensity plots of opto-control and opto-GEF-H1 signal corresponding to the orange boxes in left panels.
    E. Coli Dhfr Lov2 Fusion With N Terminal 8x His Tag In Phis8 3, supplied by Addgene inc, used in various techniques. Bioz Stars score: 90/100, based on 1 PubMed citations. ZERO BIAS - scores, article reviews, protocol conditions and more
    https://www.bioz.com/result/e. coli dhfr lov2 fusion with n-terminal 8x his-tag in phis8-3/product/Addgene inc
    Average 90 stars, based on 1 article reviews
    e. coli dhfr lov2 fusion with n-terminal 8x his-tag in phis8-3 - by Bioz Stars, 2026-02
    90/100 stars
      Buy from Supplier

    90
    Addgene inc mch and lov2-tcs (tev cleavage site)-tetr-vp16 fragments from ca-flare (tf)
    (A-D) Increased expression of a constitutively active GEF-H1 mutant in B16F1 mouse melanoma cells leads to enhanced cell contraction dynamics. (A) Representative TIRF images of cells transiently expressing myosin IIa (pCMV-mCherry-MHC IIA) together with the constitutively active GEF-H1 C53R mutant (pCMV5-EGFP-GEF-HI C53R) or a control vector (pEGFP-N1), respectively. Scale bar = 20 μm. (B) Corresponding kymograph analysis along the arrows in A. (C) Myosin IIa signal intensity plots corresponding to the orange box in A. (D) Quantification of average contraction pulse frequency, amplitude and width. N=41 GEF-H1 C53R cells and N=24 control cells from 3 independent experiments, Error bars represent S.E.M., Unpaired t-test. (E) Schematic representation of optogenetic GEF-H1 release from the mitochondria into the cytosol and subsequent stimulation of cell contraction dynamics by myosin IIa. (F) Schematic representation of stepwise strategy to generate stable B16F1 cell lines expressing a GEF-H1-coupled optogenetic tool, the corresponding control and fluorescently tagged read-out proteins. (G) Left: Representative epifluorescence images showing the mitochondrial anchored photo-sensitive <t>LOV2</t> domain (NTOM20-moxBFP-LOV2) and opto-control (mCitrine-Zdk1), or opto-GEF-H1 (mCitrine-Zdk1-GEF-H1 C53R) before, during and after optogenetic stimulation at 445-488 nm. Scale bar = 10 μm. Right: Intensity plots of opto-control and opto-GEF-H1 signal corresponding to the orange boxes in left panels.
    Mch And Lov2 Tcs (Tev Cleavage Site) Tetr Vp16 Fragments From Ca Flare (Tf), supplied by Addgene inc, used in various techniques. Bioz Stars score: 90/100, based on 1 PubMed citations. ZERO BIAS - scores, article reviews, protocol conditions and more
    https://www.bioz.com/result/mch and lov2-tcs (tev cleavage site)-tetr-vp16 fragments from ca-flare (tf)/product/Addgene inc
    Average 90 stars, based on 1 article reviews
    mch and lov2-tcs (tev cleavage site)-tetr-vp16 fragments from ca-flare (tf) - by Bioz Stars, 2026-02
    90/100 stars
      Buy from Supplier

    90
    Photoswitch Biosciences lov2 photoswitch
    (A-D) Increased expression of a constitutively active GEF-H1 mutant in B16F1 mouse melanoma cells leads to enhanced cell contraction dynamics. (A) Representative TIRF images of cells transiently expressing myosin IIa (pCMV-mCherry-MHC IIA) together with the constitutively active GEF-H1 C53R mutant (pCMV5-EGFP-GEF-HI C53R) or a control vector (pEGFP-N1), respectively. Scale bar = 20 μm. (B) Corresponding kymograph analysis along the arrows in A. (C) Myosin IIa signal intensity plots corresponding to the orange box in A. (D) Quantification of average contraction pulse frequency, amplitude and width. N=41 GEF-H1 C53R cells and N=24 control cells from 3 independent experiments, Error bars represent S.E.M., Unpaired t-test. (E) Schematic representation of optogenetic GEF-H1 release from the mitochondria into the cytosol and subsequent stimulation of cell contraction dynamics by myosin IIa. (F) Schematic representation of stepwise strategy to generate stable B16F1 cell lines expressing a GEF-H1-coupled optogenetic tool, the corresponding control and fluorescently tagged read-out proteins. (G) Left: Representative epifluorescence images showing the mitochondrial anchored photo-sensitive <t>LOV2</t> domain (NTOM20-moxBFP-LOV2) and opto-control (mCitrine-Zdk1), or opto-GEF-H1 (mCitrine-Zdk1-GEF-H1 C53R) before, during and after optogenetic stimulation at 445-488 nm. Scale bar = 10 μm. Right: Intensity plots of opto-control and opto-GEF-H1 signal corresponding to the orange boxes in left panels.
    Lov2 Photoswitch, supplied by Photoswitch Biosciences, used in various techniques. Bioz Stars score: 90/100, based on 1 PubMed citations. ZERO BIAS - scores, article reviews, protocol conditions and more
    https://www.bioz.com/result/lov2 photoswitch/product/Photoswitch Biosciences
    Average 90 stars, based on 1 article reviews
    lov2 photoswitch - by Bioz Stars, 2026-02
    90/100 stars
      Buy from Supplier

    93
    Addgene inc ptriex ntom20 lov2
    (A-D) Increased expression of a constitutively active GEF-H1 mutant in B16F1 mouse melanoma cells leads to enhanced cell contraction dynamics. (A) Representative TIRF images of cells transiently expressing myosin IIa (pCMV-mCherry-MHC IIA) together with the constitutively active GEF-H1 C53R mutant (pCMV5-EGFP-GEF-HI C53R) or a control vector (pEGFP-N1), respectively. Scale bar = 20 μm. (B) Corresponding kymograph analysis along the arrows in A. (C) Myosin IIa signal intensity plots corresponding to the orange box in A. (D) Quantification of average contraction pulse frequency, amplitude and width. N=41 GEF-H1 C53R cells and N=24 control cells from 3 independent experiments, Error bars represent S.E.M., Unpaired t-test. (E) Schematic representation of optogenetic GEF-H1 release from the mitochondria into the cytosol and subsequent stimulation of cell contraction dynamics by myosin IIa. (F) Schematic representation of stepwise strategy to generate stable B16F1 cell lines expressing a GEF-H1-coupled optogenetic tool, the corresponding control and fluorescently tagged read-out proteins. (G) Left: Representative epifluorescence images showing the mitochondrial anchored photo-sensitive <t>LOV2</t> domain (NTOM20-moxBFP-LOV2) and opto-control (mCitrine-Zdk1), or opto-GEF-H1 (mCitrine-Zdk1-GEF-H1 C53R) before, during and after optogenetic stimulation at 445-488 nm. Scale bar = 10 μm. Right: Intensity plots of opto-control and opto-GEF-H1 signal corresponding to the orange boxes in left panels.
    Ptriex Ntom20 Lov2, supplied by Addgene inc, used in various techniques. Bioz Stars score: 93/100, based on 1 PubMed citations. ZERO BIAS - scores, article reviews, protocol conditions and more
    https://www.bioz.com/result/ptriex ntom20 lov2/product/Addgene inc
    Average 93 stars, based on 1 article reviews
    ptriex ntom20 lov2 - by Bioz Stars, 2026-02
    93/100 stars
      Buy from Supplier

    93
    Addgene inc optogenetic module
    For a Figure360 author presentation of , see https://doi.org/10.1016/j.celrep.2024.114649 . (A) Schematic illustration of the mechanism of action for <t>optogenetic</t> inhibitors. In the dark state, the inhibitory peptide is sequestered on mitochondria. Upon blue light illumination, it is released into the cytoplasm, where it interacts with endogenous motor proteins. (B) Overview of plasmid constructs co-transfected for the optogenetic experiments. Plasmid construct on top encodes the protein that is tethered to the mitochondria, and the bottom plasmid construct encodes the fluorophore containing inhibitory peptide. (C) Ab initio -based protein-prediction results from the I-TASSER server (top) for different optogenetic inhibitors where the segment in red shows the cloned inhibitory peptide. Domain maps of different proteins used for creating optogenetic inhibitors (bottom), with the cloned segment highlighted in red. CC, coiled-coil; CG, CAP-Gly; FHA, forkhead-associated; MD, motor domain; NC, neck coil; PH, pleckstrin homology; SP, serine-proline-rich region. (D) Snapshots from time-lapse imaging of a cell expressing NTOM20-LOV2 and mCherry-Zdk1-K2OI constructs. The yellow box shows the cytoplasmic region used for generating the intensity trace shown in (E). Scale bar, 12 μm. (E) Fluorescence intensity trace over time for the region of interest in cytoplasm for the cell shown in (D), demonstrating the reversible aspect of optogenetic inhibitors.
    Optogenetic Module, supplied by Addgene inc, used in various techniques. Bioz Stars score: 93/100, based on 1 PubMed citations. ZERO BIAS - scores, article reviews, protocol conditions and more
    https://www.bioz.com/result/optogenetic module/product/Addgene inc
    Average 93 stars, based on 1 article reviews
    optogenetic module - by Bioz Stars, 2026-02
    93/100 stars
      Buy from Supplier

    93
    Addgene inc plasmids ptriex ntom20 lov2
    For a Figure360 author presentation of , see https://doi.org/10.1016/j.celrep.2024.114649 . (A) Schematic illustration of the mechanism of action for <t>optogenetic</t> inhibitors. In the dark state, the inhibitory peptide is sequestered on mitochondria. Upon blue light illumination, it is released into the cytoplasm, where it interacts with endogenous motor proteins. (B) Overview of plasmid constructs co-transfected for the optogenetic experiments. Plasmid construct on top encodes the protein that is tethered to the mitochondria, and the bottom plasmid construct encodes the fluorophore containing inhibitory peptide. (C) Ab initio -based protein-prediction results from the I-TASSER server (top) for different optogenetic inhibitors where the segment in red shows the cloned inhibitory peptide. Domain maps of different proteins used for creating optogenetic inhibitors (bottom), with the cloned segment highlighted in red. CC, coiled-coil; CG, CAP-Gly; FHA, forkhead-associated; MD, motor domain; NC, neck coil; PH, pleckstrin homology; SP, serine-proline-rich region. (D) Snapshots from time-lapse imaging of a cell expressing NTOM20-LOV2 and mCherry-Zdk1-K2OI constructs. The yellow box shows the cytoplasmic region used for generating the intensity trace shown in (E). Scale bar, 12 μm. (E) Fluorescence intensity trace over time for the region of interest in cytoplasm for the cell shown in (D), demonstrating the reversible aspect of optogenetic inhibitors.
    Plasmids Ptriex Ntom20 Lov2, supplied by Addgene inc, used in various techniques. Bioz Stars score: 93/100, based on 1 PubMed citations. ZERO BIAS - scores, article reviews, protocol conditions and more
    https://www.bioz.com/result/plasmids ptriex ntom20 lov2/product/Addgene inc
    Average 93 stars, based on 1 article reviews
    plasmids ptriex ntom20 lov2 - by Bioz Stars, 2026-02
    93/100 stars
      Buy from Supplier

    Image Search Results


    (A-D) Increased expression of a constitutively active GEF-H1 mutant in B16F1 mouse melanoma cells leads to enhanced cell contraction dynamics. (A) Representative TIRF images of cells transiently expressing myosin IIa (pCMV-mCherry-MHC IIA) together with the constitutively active GEF-H1 C53R mutant (pCMV5-EGFP-GEF-HI C53R) or a control vector (pEGFP-N1), respectively. Scale bar = 20 μm. (B) Corresponding kymograph analysis along the arrows in A. (C) Myosin IIa signal intensity plots corresponding to the orange box in A. (D) Quantification of average contraction pulse frequency, amplitude and width. N=41 GEF-H1 C53R cells and N=24 control cells from 3 independent experiments, Error bars represent S.E.M., Unpaired t-test. (E) Schematic representation of optogenetic GEF-H1 release from the mitochondria into the cytosol and subsequent stimulation of cell contraction dynamics by myosin IIa. (F) Schematic representation of stepwise strategy to generate stable B16F1 cell lines expressing a GEF-H1-coupled optogenetic tool, the corresponding control and fluorescently tagged read-out proteins. (G) Left: Representative epifluorescence images showing the mitochondrial anchored photo-sensitive LOV2 domain (NTOM20-moxBFP-LOV2) and opto-control (mCitrine-Zdk1), or opto-GEF-H1 (mCitrine-Zdk1-GEF-H1 C53R) before, during and after optogenetic stimulation at 445-488 nm. Scale bar = 10 μm. Right: Intensity plots of opto-control and opto-GEF-H1 signal corresponding to the orange boxes in left panels.

    Journal: bioRxiv

    Article Title: Optogenetic stimulation of Lbc GEF-mediated Rho activity dynamics promotes cell invasion

    doi: 10.1101/2025.03.28.646036

    Figure Lengend Snippet: (A-D) Increased expression of a constitutively active GEF-H1 mutant in B16F1 mouse melanoma cells leads to enhanced cell contraction dynamics. (A) Representative TIRF images of cells transiently expressing myosin IIa (pCMV-mCherry-MHC IIA) together with the constitutively active GEF-H1 C53R mutant (pCMV5-EGFP-GEF-HI C53R) or a control vector (pEGFP-N1), respectively. Scale bar = 20 μm. (B) Corresponding kymograph analysis along the arrows in A. (C) Myosin IIa signal intensity plots corresponding to the orange box in A. (D) Quantification of average contraction pulse frequency, amplitude and width. N=41 GEF-H1 C53R cells and N=24 control cells from 3 independent experiments, Error bars represent S.E.M., Unpaired t-test. (E) Schematic representation of optogenetic GEF-H1 release from the mitochondria into the cytosol and subsequent stimulation of cell contraction dynamics by myosin IIa. (F) Schematic representation of stepwise strategy to generate stable B16F1 cell lines expressing a GEF-H1-coupled optogenetic tool, the corresponding control and fluorescently tagged read-out proteins. (G) Left: Representative epifluorescence images showing the mitochondrial anchored photo-sensitive LOV2 domain (NTOM20-moxBFP-LOV2) and opto-control (mCitrine-Zdk1), or opto-GEF-H1 (mCitrine-Zdk1-GEF-H1 C53R) before, during and after optogenetic stimulation at 445-488 nm. Scale bar = 10 μm. Right: Intensity plots of opto-control and opto-GEF-H1 signal corresponding to the orange boxes in left panels.

    Article Snippet: To generate the PiggyBac vector pPBCAG-NTOM20-moxBFP-GS-LOV2-IRES-Puro for expression of the mitochondrial-targeted LOV2 domain, the fluorescent moxBFP tag (Addgene plasmid #68064; ) was amplified together with a GSGSGS linker sequence via PCR and inserted into pTriEx-NTOM20-mVenus-LOV2 (kind gift from Klaus Hahn, University of North Carolina, Chapel Hill, USA) using BamHI and BseRI restriction sites and Gibson assembly.

    Techniques: Expressing, Mutagenesis, Control, Plasmid Preparation

    For a Figure360 author presentation of , see https://doi.org/10.1016/j.celrep.2024.114649 . (A) Schematic illustration of the mechanism of action for optogenetic inhibitors. In the dark state, the inhibitory peptide is sequestered on mitochondria. Upon blue light illumination, it is released into the cytoplasm, where it interacts with endogenous motor proteins. (B) Overview of plasmid constructs co-transfected for the optogenetic experiments. Plasmid construct on top encodes the protein that is tethered to the mitochondria, and the bottom plasmid construct encodes the fluorophore containing inhibitory peptide. (C) Ab initio -based protein-prediction results from the I-TASSER server (top) for different optogenetic inhibitors where the segment in red shows the cloned inhibitory peptide. Domain maps of different proteins used for creating optogenetic inhibitors (bottom), with the cloned segment highlighted in red. CC, coiled-coil; CG, CAP-Gly; FHA, forkhead-associated; MD, motor domain; NC, neck coil; PH, pleckstrin homology; SP, serine-proline-rich region. (D) Snapshots from time-lapse imaging of a cell expressing NTOM20-LOV2 and mCherry-Zdk1-K2OI constructs. The yellow box shows the cytoplasmic region used for generating the intensity trace shown in (E). Scale bar, 12 μm. (E) Fluorescence intensity trace over time for the region of interest in cytoplasm for the cell shown in (D), demonstrating the reversible aspect of optogenetic inhibitors.

    Journal: Cell reports

    Article Title: Optogenetic control of kinesin-1, -2, -3 and dynein reveals their specific roles in vesicular transport

    doi: 10.1016/j.celrep.2024.114649

    Figure Lengend Snippet: For a Figure360 author presentation of , see https://doi.org/10.1016/j.celrep.2024.114649 . (A) Schematic illustration of the mechanism of action for optogenetic inhibitors. In the dark state, the inhibitory peptide is sequestered on mitochondria. Upon blue light illumination, it is released into the cytoplasm, where it interacts with endogenous motor proteins. (B) Overview of plasmid constructs co-transfected for the optogenetic experiments. Plasmid construct on top encodes the protein that is tethered to the mitochondria, and the bottom plasmid construct encodes the fluorophore containing inhibitory peptide. (C) Ab initio -based protein-prediction results from the I-TASSER server (top) for different optogenetic inhibitors where the segment in red shows the cloned inhibitory peptide. Domain maps of different proteins used for creating optogenetic inhibitors (bottom), with the cloned segment highlighted in red. CC, coiled-coil; CG, CAP-Gly; FHA, forkhead-associated; MD, motor domain; NC, neck coil; PH, pleckstrin homology; SP, serine-proline-rich region. (D) Snapshots from time-lapse imaging of a cell expressing NTOM20-LOV2 and mCherry-Zdk1-K2OI constructs. The yellow box shows the cytoplasmic region used for generating the intensity trace shown in (E). Scale bar, 12 μm. (E) Fluorescence intensity trace over time for the region of interest in cytoplasm for the cell shown in (D), demonstrating the reversible aspect of optogenetic inhibitors.

    Article Snippet: The optogenetic module was derived from plasmids pTriEx-NTOM20-LOV2 and pTriEx-mCherry-Zdk1 (Addgene plasmid #81009 and #81057 respectively), gifts from Klaus Hahn.

    Techniques: Plasmid Preparation, Construct, Transfection, Clone Assay, Imaging, Expressing, Fluorescence

    (A) Scheme showing the inhibition of motors that are driving early endosomes in the lit state (left), with the inhibitory peptide labeled with an orange fluorophore, while the early endosome marker, Rab5, is labeled with a far-red fluorophore. On the right is the summary of change in motility upon inhibition of different transport motors, shown by differently colored arrows, where the length of the arrow indicates the run length of the cargo. (B) The MSD plot of early endosomes in untransfected U2OS cells, which do not express optogenetic inhibitors, without and with blue light illumination, shown in black and blue, respectively (mean ± SEM). Each cell was first imaged without shining any blue light, and then with blue light illumination. This blue light control shows that blue light itself does not affect the motility of early endosomes. (C) Polar plot projections of early endosomes trajectories from time-lapse images, centered around the cell nucleus, showing the directionality of Rab5-enriched endosomes in a U2OS cell under dark-state (top) and lit-state (bottom) conditions. The four panels correspond to cells that were transiently transfected with different optogenetic inhibitors. The net directionality was categorized as inward (magenta), outward (green), or stationary (gray) based on Rg values, and rho values in the first and the last points of the trajectories. (D) Plot shows the changes in average velocity for all the trajectories in a cell (corresponding to the cell shown in C) upon blue light illumination. For velocity analysis, average velocity was first categorized into three types, namely, positive velocity, negative velocity, and neutral velocity. It was then normalized to the average velocity in the time window just before inhibition, allowing us to compare changes at the time of inhibition. The color scheme is also based on the average velocity of the trajectories right before the inhibition, where green represents positive average velocity before inhibition, magenta represents negative average velocity before inhibition, and gray represents stationary vesicles that were not moving before inhibition. (E and F) Rg and MSD plots for motility of early endosomes upon optogenetic inhibition of different motors. Each dot in the Rg plot indicates a cell, with a line connecting the same cell under the two conditions. A yellow line indicates an increase in Rg, whereas a purple line indicates a decrease, and a black line indicates no change. Black horizontal line shows mean while vertical gray line indicates SEM. For the MSD plot, dark state and lit state are shown in gray and blue, respectively (mean ± SEM). The number of cells, trajectories, and experiments used for the plots are as follows: K1OI: 41 cells, 7,713 trajectories over 5 experiments; K2OI: 48 cells, 8,560 trajectories over 3 experiments; K3OI: 47 cells, 8,976 trajectories over 5 experiments; DOI: 26 cells, 4,859 trajectories over 3 experiments. Statistical analysis for Rg experiments was done using the Wilcoxon signed rank test, and asterisks indicate significance as follows: * p ≤ 0.05; ** p ≤ 0.01; *** p ≤ 0.001.

    Journal: Cell reports

    Article Title: Optogenetic control of kinesin-1, -2, -3 and dynein reveals their specific roles in vesicular transport

    doi: 10.1016/j.celrep.2024.114649

    Figure Lengend Snippet: (A) Scheme showing the inhibition of motors that are driving early endosomes in the lit state (left), with the inhibitory peptide labeled with an orange fluorophore, while the early endosome marker, Rab5, is labeled with a far-red fluorophore. On the right is the summary of change in motility upon inhibition of different transport motors, shown by differently colored arrows, where the length of the arrow indicates the run length of the cargo. (B) The MSD plot of early endosomes in untransfected U2OS cells, which do not express optogenetic inhibitors, without and with blue light illumination, shown in black and blue, respectively (mean ± SEM). Each cell was first imaged without shining any blue light, and then with blue light illumination. This blue light control shows that blue light itself does not affect the motility of early endosomes. (C) Polar plot projections of early endosomes trajectories from time-lapse images, centered around the cell nucleus, showing the directionality of Rab5-enriched endosomes in a U2OS cell under dark-state (top) and lit-state (bottom) conditions. The four panels correspond to cells that were transiently transfected with different optogenetic inhibitors. The net directionality was categorized as inward (magenta), outward (green), or stationary (gray) based on Rg values, and rho values in the first and the last points of the trajectories. (D) Plot shows the changes in average velocity for all the trajectories in a cell (corresponding to the cell shown in C) upon blue light illumination. For velocity analysis, average velocity was first categorized into three types, namely, positive velocity, negative velocity, and neutral velocity. It was then normalized to the average velocity in the time window just before inhibition, allowing us to compare changes at the time of inhibition. The color scheme is also based on the average velocity of the trajectories right before the inhibition, where green represents positive average velocity before inhibition, magenta represents negative average velocity before inhibition, and gray represents stationary vesicles that were not moving before inhibition. (E and F) Rg and MSD plots for motility of early endosomes upon optogenetic inhibition of different motors. Each dot in the Rg plot indicates a cell, with a line connecting the same cell under the two conditions. A yellow line indicates an increase in Rg, whereas a purple line indicates a decrease, and a black line indicates no change. Black horizontal line shows mean while vertical gray line indicates SEM. For the MSD plot, dark state and lit state are shown in gray and blue, respectively (mean ± SEM). The number of cells, trajectories, and experiments used for the plots are as follows: K1OI: 41 cells, 7,713 trajectories over 5 experiments; K2OI: 48 cells, 8,560 trajectories over 3 experiments; K3OI: 47 cells, 8,976 trajectories over 5 experiments; DOI: 26 cells, 4,859 trajectories over 3 experiments. Statistical analysis for Rg experiments was done using the Wilcoxon signed rank test, and asterisks indicate significance as follows: * p ≤ 0.05; ** p ≤ 0.01; *** p ≤ 0.001.

    Article Snippet: The optogenetic module was derived from plasmids pTriEx-NTOM20-LOV2 and pTriEx-mCherry-Zdk1 (Addgene plasmid #81009 and #81057 respectively), gifts from Klaus Hahn.

    Techniques: Inhibition, Labeling, Marker, Control, Transfection

    (A) Scheme showing the inhibition of motors that are driving late endosomes in the lit state (left), with the inhibitory peptide labeled with an orange fluorophore, while late endosome marker, Rab7, is labeled with a far-red fluorophore. On the right is the summary of change in motility upon inhibition of different transport motors, shown by differently colored arrows, where the length of the arrow indicates the run length of the cargo. (B) The MSD plot of late endosomes in untransfected U2OS cells, that do not express optogenetic inhibitors, without and with blue light illumination, shown in black and blue, respectively (mean ± SEM). Each cell was first imaged without shining any blue light, and then with blue light illumination. This blue light control shows that blue light itself does not affect the motility of late endosomes. (C) Polar plot projections of late endosome trajectories from time-lapse images, centered around the cell nucleus, showing the directionality of Rab7-enriched endosomes in a U2OS cell under dark-state (top) and lit-state (bottom) conditions. The four panels correspond to cells that were transiently transfected with different optogenetic inhibitors. The net directionality was categorized as inward (magenta), outward (green), or stationary (gray) based on Rg values, and rho values in the first and the last points of the trajectories. (D) Plot shows the changes in average velocity for all the trajectories in a cell (corresponding to the cell shown in C) upon blue light illumination. For velocity analysis, average velocity was first categorized into three types, namely, positive velocity, negative velocity, and neutral velocity. It was then normalized to the average velocity in the time window just before inhibition, allowing us to compare changes at the time of inhibition. The color scheme is also based on the average velocity of the trajectories right before the inhibition, where green represents positive average velocity before inhibition, magenta represents negative average velocity before inhibition, and gray represents stationary vesicles that were not moving before inhibition. (E and F) Rg and MSD plots for the motility of late endosomes upon optogenetic inhibition of different motors. Each dot in the Rg plot indicates a cell, with a line connecting the same cell under the two conditions. A yellow line indicates an increase in Rg, whereas a purple line indicates a decrease, and a black line indicates no change. Black horizontal line shows mean while vertical gray line indicates SEM. For the MSD plot, dark state and lit state are shown in gray and blue, respectively (mean ± SEM). The number of cells, trajectories, and experiments used for the plots are as follows: K1OI: 34 cells, 5,638 trajectories over 4 experiments; K2OI: 37 cells, 6,189 trajectories over 3 experiments; K3OI: 28 cells, 4,473 trajectories over 3 experiments; DOI: 27 cells, 4,512 trajectories over 3 experiments. Statistical analysis for Rg experiments was done using the Wilcoxon signed rank test and asterisks indicate significance as follows: * p ≤ 0.05; ** p ≤ 0.01; *** p ≤ 0.001.

    Journal: Cell reports

    Article Title: Optogenetic control of kinesin-1, -2, -3 and dynein reveals their specific roles in vesicular transport

    doi: 10.1016/j.celrep.2024.114649

    Figure Lengend Snippet: (A) Scheme showing the inhibition of motors that are driving late endosomes in the lit state (left), with the inhibitory peptide labeled with an orange fluorophore, while late endosome marker, Rab7, is labeled with a far-red fluorophore. On the right is the summary of change in motility upon inhibition of different transport motors, shown by differently colored arrows, where the length of the arrow indicates the run length of the cargo. (B) The MSD plot of late endosomes in untransfected U2OS cells, that do not express optogenetic inhibitors, without and with blue light illumination, shown in black and blue, respectively (mean ± SEM). Each cell was first imaged without shining any blue light, and then with blue light illumination. This blue light control shows that blue light itself does not affect the motility of late endosomes. (C) Polar plot projections of late endosome trajectories from time-lapse images, centered around the cell nucleus, showing the directionality of Rab7-enriched endosomes in a U2OS cell under dark-state (top) and lit-state (bottom) conditions. The four panels correspond to cells that were transiently transfected with different optogenetic inhibitors. The net directionality was categorized as inward (magenta), outward (green), or stationary (gray) based on Rg values, and rho values in the first and the last points of the trajectories. (D) Plot shows the changes in average velocity for all the trajectories in a cell (corresponding to the cell shown in C) upon blue light illumination. For velocity analysis, average velocity was first categorized into three types, namely, positive velocity, negative velocity, and neutral velocity. It was then normalized to the average velocity in the time window just before inhibition, allowing us to compare changes at the time of inhibition. The color scheme is also based on the average velocity of the trajectories right before the inhibition, where green represents positive average velocity before inhibition, magenta represents negative average velocity before inhibition, and gray represents stationary vesicles that were not moving before inhibition. (E and F) Rg and MSD plots for the motility of late endosomes upon optogenetic inhibition of different motors. Each dot in the Rg plot indicates a cell, with a line connecting the same cell under the two conditions. A yellow line indicates an increase in Rg, whereas a purple line indicates a decrease, and a black line indicates no change. Black horizontal line shows mean while vertical gray line indicates SEM. For the MSD plot, dark state and lit state are shown in gray and blue, respectively (mean ± SEM). The number of cells, trajectories, and experiments used for the plots are as follows: K1OI: 34 cells, 5,638 trajectories over 4 experiments; K2OI: 37 cells, 6,189 trajectories over 3 experiments; K3OI: 28 cells, 4,473 trajectories over 3 experiments; DOI: 27 cells, 4,512 trajectories over 3 experiments. Statistical analysis for Rg experiments was done using the Wilcoxon signed rank test and asterisks indicate significance as follows: * p ≤ 0.05; ** p ≤ 0.01; *** p ≤ 0.001.

    Article Snippet: The optogenetic module was derived from plasmids pTriEx-NTOM20-LOV2 and pTriEx-mCherry-Zdk1 (Addgene plasmid #81009 and #81057 respectively), gifts from Klaus Hahn.

    Techniques: Inhibition, Labeling, Marker, Control, Transfection

    (A) Scheme showing the inhibition of motors that are driving lysosomes in the lit state (left), with the inhibitory peptide labeled with an orange fluorophore, while the lysosome is labeled with far-red LysoTracker. On the right is the summary of change in motility upon inhibition of different transport motors, shown by differently colored arrows, where the length of the arrow indicates the run length of the cargo. (B) The MSD plot of lysosomes in untransfected U2OS cells, which do not express optogenetic inhibitors, without and with blue light illumination, shown in black and blue, respectively (mean ± SEM). Each cell was first imaged without shining any blue light, and then with blue light illumination. This blue light control shows that blue light itself does not affect the motility of lysosomes. (C) Polar plot projections of lysosome trajectories from time-lapse images, centered around the cell nucleus, showing their directionality in a U2OS cell under dark-state (top) and lit-state (bottom) conditions. The four panels correspond to cells that were transiently transfected with different optogenetic inhibitors. The net directionality was categorized as inward (magenta), outward (green), or stationary (gray) based on Rg values, and rho values in the first and last points of the trajectories. (D) Plot shows the changes in average velocity for all the trajectories in a cell (corresponding to the cell shown in C) upon blue light illumination. For velocity analysis, average velocity was first categorized into three types, namely, positive velocity, negative velocity, and neutral velocity. It was then normalized to the average velocity in the time window just before inhibition, allowing us to compare changes at the time of inhibition. The color scheme is also based on the average velocity of the trajectories right before the inhibition, where green represents positive average velocity before inhibition, magenta represents negative average velocity before inhibition, and gray represents stationary vesicles that were not moving before inhibition. (E and F) Rg and MSD plots for motility of lysosomes upon optogenetic inhibition of different motors. Each dot in the Rg plot indicates a cell, with a line connecting the same cell under the two conditions. A yellow line indicates an increase in Rg, whereas a purple line indicates a decrease, and a black line indicates no change. The black horizontal line shows mean, while vertical gray line indicates SEM. For the MSD plot, dark state and lit state are shown in gray and blue, respectively (mean ± SEM). The number of cells, trajectories, and experiments used for the plots are as follows: K1OI: 34 cells, 3,791 trajectories over 4 experiments; K2OI: 34 cells, 3,843 trajectories over 4 experiments; K3OI: 34 cells, 3,798 trajectories over 5 experiments; DOI: 27 cells, 3,114 trajectories over 3 experiments. Statistical analysis for Rg experiments was done using the Wilcoxon signed rank test, and asterisks indicate significance as follows: * p ≤ 0.05; ** p ≤ 0.01; *** p ≤ 0.001.

    Journal: Cell reports

    Article Title: Optogenetic control of kinesin-1, -2, -3 and dynein reveals their specific roles in vesicular transport

    doi: 10.1016/j.celrep.2024.114649

    Figure Lengend Snippet: (A) Scheme showing the inhibition of motors that are driving lysosomes in the lit state (left), with the inhibitory peptide labeled with an orange fluorophore, while the lysosome is labeled with far-red LysoTracker. On the right is the summary of change in motility upon inhibition of different transport motors, shown by differently colored arrows, where the length of the arrow indicates the run length of the cargo. (B) The MSD plot of lysosomes in untransfected U2OS cells, which do not express optogenetic inhibitors, without and with blue light illumination, shown in black and blue, respectively (mean ± SEM). Each cell was first imaged without shining any blue light, and then with blue light illumination. This blue light control shows that blue light itself does not affect the motility of lysosomes. (C) Polar plot projections of lysosome trajectories from time-lapse images, centered around the cell nucleus, showing their directionality in a U2OS cell under dark-state (top) and lit-state (bottom) conditions. The four panels correspond to cells that were transiently transfected with different optogenetic inhibitors. The net directionality was categorized as inward (magenta), outward (green), or stationary (gray) based on Rg values, and rho values in the first and last points of the trajectories. (D) Plot shows the changes in average velocity for all the trajectories in a cell (corresponding to the cell shown in C) upon blue light illumination. For velocity analysis, average velocity was first categorized into three types, namely, positive velocity, negative velocity, and neutral velocity. It was then normalized to the average velocity in the time window just before inhibition, allowing us to compare changes at the time of inhibition. The color scheme is also based on the average velocity of the trajectories right before the inhibition, where green represents positive average velocity before inhibition, magenta represents negative average velocity before inhibition, and gray represents stationary vesicles that were not moving before inhibition. (E and F) Rg and MSD plots for motility of lysosomes upon optogenetic inhibition of different motors. Each dot in the Rg plot indicates a cell, with a line connecting the same cell under the two conditions. A yellow line indicates an increase in Rg, whereas a purple line indicates a decrease, and a black line indicates no change. The black horizontal line shows mean, while vertical gray line indicates SEM. For the MSD plot, dark state and lit state are shown in gray and blue, respectively (mean ± SEM). The number of cells, trajectories, and experiments used for the plots are as follows: K1OI: 34 cells, 3,791 trajectories over 4 experiments; K2OI: 34 cells, 3,843 trajectories over 4 experiments; K3OI: 34 cells, 3,798 trajectories over 5 experiments; DOI: 27 cells, 3,114 trajectories over 3 experiments. Statistical analysis for Rg experiments was done using the Wilcoxon signed rank test, and asterisks indicate significance as follows: * p ≤ 0.05; ** p ≤ 0.01; *** p ≤ 0.001.

    Article Snippet: The optogenetic module was derived from plasmids pTriEx-NTOM20-LOV2 and pTriEx-mCherry-Zdk1 (Addgene plasmid #81009 and #81057 respectively), gifts from Klaus Hahn.

    Techniques: Inhibition, Labeling, Control, Transfection

    (A) Plots for difference in Rg upon optogenetic inhibition of different motors for early endosomes, late endosomes, and lysosomes. The solid horizontal line indicates mean, and the dashed horizontal line indicates median. Top summarizes the Rg results reported in figures above and bottom indicates the normalized Rg values obtained from the modeled trajectories under different inhibitory conditions. The simulated trajectories exhibit a broader distribution as results for each simulated trajectory are plotted, compared to the mean of the trajectories for each cell in the experimental data. Binding rates are estimated to be reduced by ~40%–60% for K1OI, 30%–40% for K2OI, 30%–50% for K3OI, and 25%–50% for DOI depending on the cargo. p values were calculated from Student’s t test. (B) Plots indicating changes in directionality upon inhibition of different motors for early endosomes, late endosomes, and lysosomes. Trajectories were categorized into outward, inward, or stationary based on the difference in positions for end and start points of the trajectory. Filled circles, triangles, and squares indicate experimental data for three different cells, and empty circles indicate the modeling results.

    Journal: Cell reports

    Article Title: Optogenetic control of kinesin-1, -2, -3 and dynein reveals their specific roles in vesicular transport

    doi: 10.1016/j.celrep.2024.114649

    Figure Lengend Snippet: (A) Plots for difference in Rg upon optogenetic inhibition of different motors for early endosomes, late endosomes, and lysosomes. The solid horizontal line indicates mean, and the dashed horizontal line indicates median. Top summarizes the Rg results reported in figures above and bottom indicates the normalized Rg values obtained from the modeled trajectories under different inhibitory conditions. The simulated trajectories exhibit a broader distribution as results for each simulated trajectory are plotted, compared to the mean of the trajectories for each cell in the experimental data. Binding rates are estimated to be reduced by ~40%–60% for K1OI, 30%–40% for K2OI, 30%–50% for K3OI, and 25%–50% for DOI depending on the cargo. p values were calculated from Student’s t test. (B) Plots indicating changes in directionality upon inhibition of different motors for early endosomes, late endosomes, and lysosomes. Trajectories were categorized into outward, inward, or stationary based on the difference in positions for end and start points of the trajectory. Filled circles, triangles, and squares indicate experimental data for three different cells, and empty circles indicate the modeling results.

    Article Snippet: The optogenetic module was derived from plasmids pTriEx-NTOM20-LOV2 and pTriEx-mCherry-Zdk1 (Addgene plasmid #81009 and #81057 respectively), gifts from Klaus Hahn.

    Techniques: Inhibition, Binding Assay